
Marketing KPIs are the handful of numbers that tell you whether your marketing is working toward a business goal. A KPI is a metric with a target attached: "a ROAS of 3.5 on Google Ads" is a KPI, "ad clicks" on its own is just a metric. This guide shows how to choose marketing KPIs, gives examples with formulas for each channel and explains how to put them in a dashboard your clients will actually read.
What are marketing KPIs?
A marketing KPI (key performance indicator) is a measurable value that shows how well a marketing activity is reaching a specific objective within a set time. Three things make a number a KPI: it is linked to a goal, it has a target, and someone acts on it when it moves.
Marketing KPIs work at different levels. A CMO looks at revenue from marketing and customer acquisition cost. A campaign manager looks at ROAS, cost per lead and conversion rate. An SEO specialist looks at organic clicks and rankings for money pages. All are valid marketing KPIs, as long as each one answers a question someone is responsible for.
KPI vs metric: what's the difference?
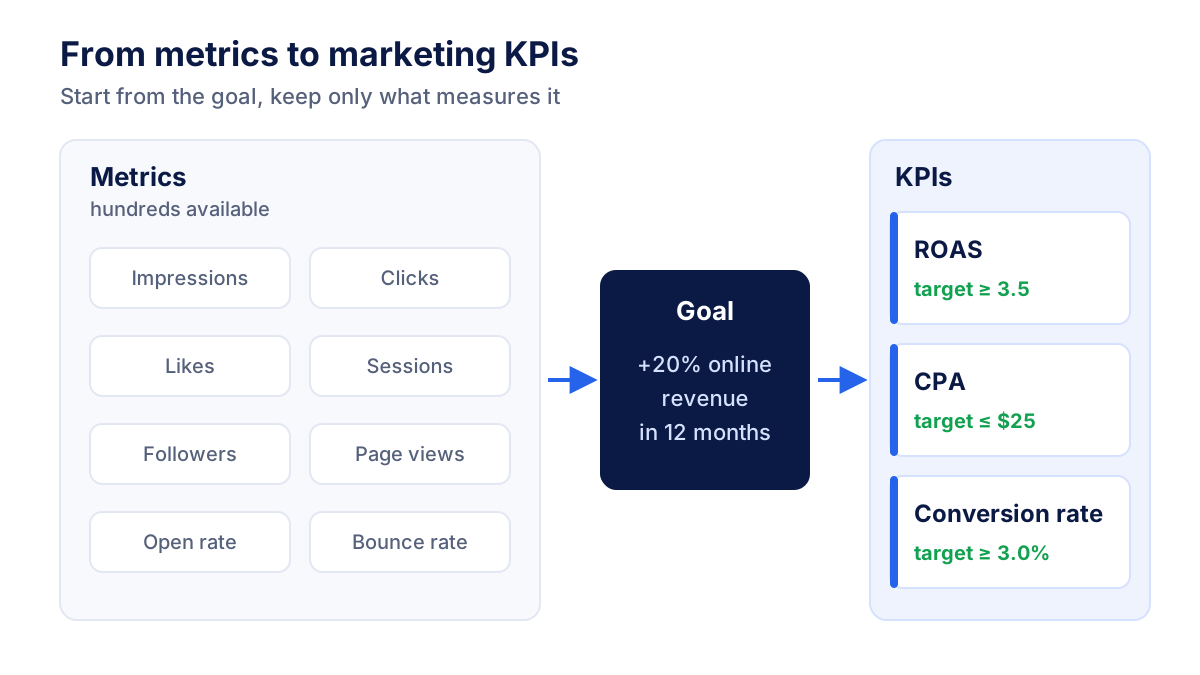
A metric is any number your tools record. Google Analytics 4, Google Ads and Meta Ads give you hundreds of them: impressions, sessions, likes, scroll depth, video views. A KPI is one of those metrics, picked because it shows progress toward a goal and given a target.
| Metric | KPI | |
|---|---|---|
| Definition | Any measurable number | A metric tied to a goal |
| Target | Not required | Always has one |
| How many | Hundreds | 3 to 5 per goal |
| Example | Ad impressions | ROAS of at least 3.5 |
| Use | Diagnosis, detail | Decisions, reporting |
The distinction matters in reporting. If a monthly report shows 40 numbers with equal weight, the client cannot tell which ones matter. Keep KPIs at the top and metrics underneath, where they explain why a KPI went up or down.
How to choose the right marketing KPIs
The quickest way to choose marketing KPIs is to start from the goal and work backwards, never from the data your tools happen to show. Follow these steps:
- Write the business goal in one sentence, with a number and a date: "grow online revenue by 20% in 12 months" or "get 60 qualified leads per month".
- Find the funnel stage that limits the goal. A shop with plenty of traffic and few sales has a conversion problem, not a reach problem.
- Pick one main KPI per stage you work on, plus one or two supporting KPIs.
- Set a target and a baseline using your own history from the last 3 to 12 months, not industry averages.
- Write the formula and the data source for each KPI, so everyone calculates it the same way.
- Decide who reviews it and how often: weekly for paid campaigns, monthly for SEO and brand.
Marketing KPIs by funnel stage
Different stages of the funnel need different KPIs. Awareness KPIs measure how many of the right people see you, consideration KPIs measure interest, conversion KPIs measure results, and retention KPIs measure whether customers come back.
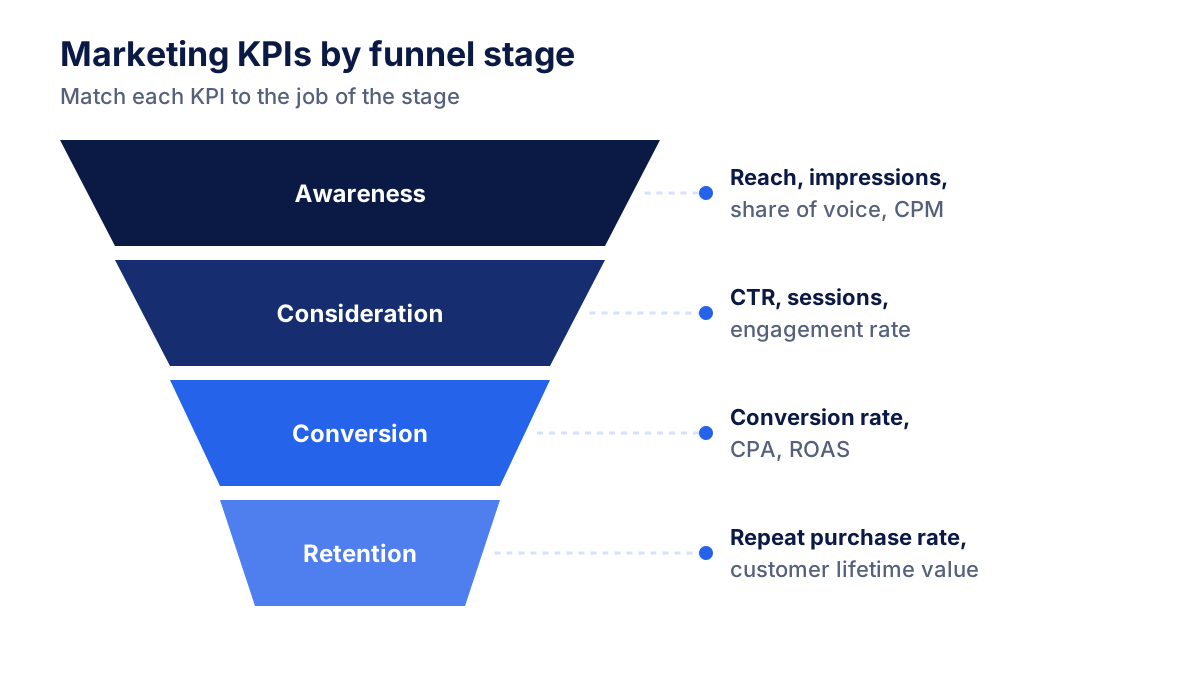
If a campaign's job is awareness, judging it on ROAS will make it look like a failure. If a campaign's job is sales, a low CPM tells you nothing about whether it worked. Match the KPI to the job.
Marketing KPI examples by channel
The table lists common digital marketing KPIs by channel, with the formula you can use in a report. Treat it as a menu, not a checklist: pick the ones that match your goal.
| Channel | KPI | Formula |
|---|---|---|
| SEO | Organic clicks | Clicks from Google Search Console or Bing Webmaster Tools |
| SEO | Organic CTR | clicks ÷ impressions × 100 |
| SEO | Non-brand organic traffic | organic sessions without brand queries |
| Paid ads | ROAS | ad revenue ÷ ad spend |
| Paid ads | CPA (cost per acquisition) | ad spend ÷ conversions |
| Paid ads | CPM | spend ÷ impressions × 1,000 |
| Social media | Engagement rate | interactions ÷ reach × 100 |
| Social media | Share of voice | your mentions ÷ total mentions in the category × 100 |
| Click rate | unique clicks ÷ delivered emails × 100 | |
| Revenue per email | email revenue ÷ delivered emails | |
| E-commerce | Conversion rate | orders ÷ sessions × 100 |
| E-commerce | Average order value | revenue ÷ orders |
| E-commerce | Customer acquisition cost | marketing spend ÷ new customers |
A few notes on these marketing KPI examples. For the ad and SEO click metrics, our guide on CTR and what a good click-through rate is explains how to read them by position and format. For paid campaigns, the ROAS guide shows how to work out your break-even value from your margin. SEO KPIs come mostly from Google Search Console, whose performance report shows clicks, impressions, CTR and average position.
Social media KPIs are the easiest to inflate. Follower counts and likes are metrics; engagement rate on reach, clicks to the site and share of voice say more about whether social work is paying off. For email marketing KPIs, rely on clicks rather than opens, since privacy features in mail apps make open rates unreliable.
A worked example: from metrics to KPIs
Let's say you run marketing for an online shop with the goal "grow online revenue by 20% this year". Here is one hypothetical month:
- Ad spend: $5,000
- Sessions: 10,000
- Orders: 250
- Revenue: $20,000
From these four metrics you calculate the KPIs:
- ROAS = $20,000 ÷ $5,000 = 4.0 (target 3.5: on track)
- CPA = $5,000 ÷ 250 = $20 (target $25: on track)
- Conversion rate = 250 ÷ 10,000 × 100 = 2.5% (target 3.0%: below)
- Average order value = $20,000 ÷ 250 = $80
The month reads clearly: paid traffic is efficient, the site converts less than planned. The next action is on the checkout or product pages, not on the ad budget. That is what KPIs are for: they point to the next decision.
To trust these numbers across channels, tag your links consistently. Our guide on UTM parameters shows how to do it so email, social and paid traffic land in the right row of the report.
How to build a marketing KPI dashboard for clients
A marketing KPI dashboard is a single page that shows the agreed KPIs, their targets and their trend, so a client or manager can see in a minute whether marketing is on track. In the reports we build for clients, the structure that works best is always the same.
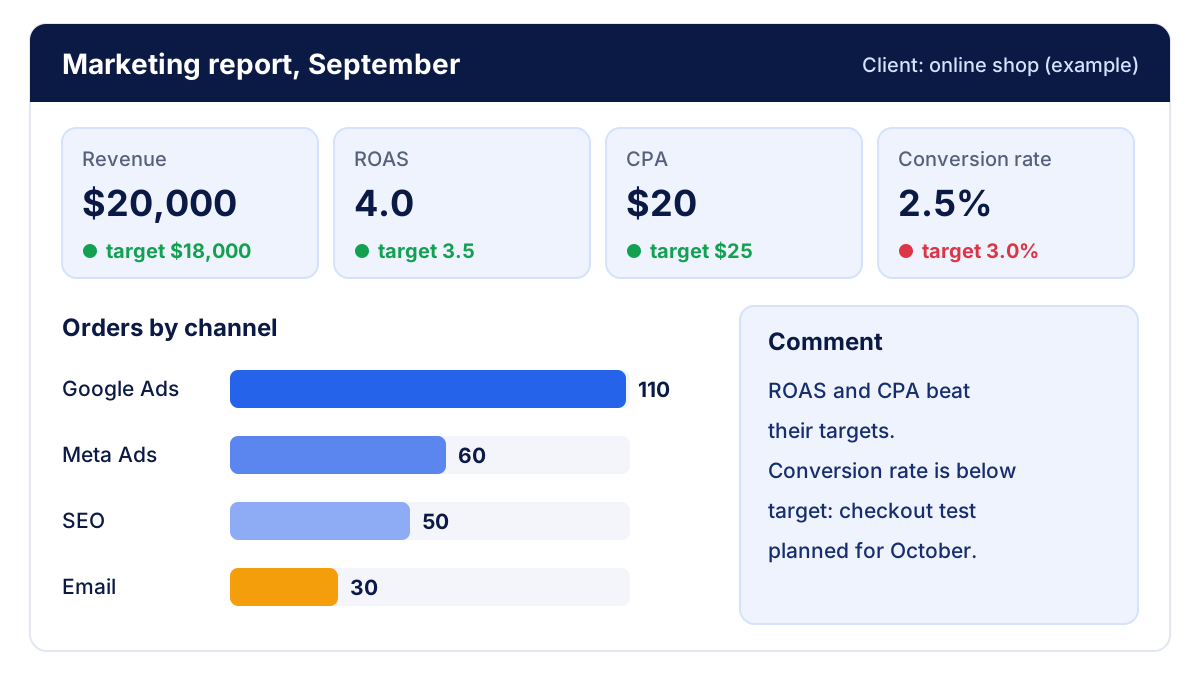
- Top row: 4 to 8 KPI tiles. Each tile shows the value, the target and the change against the previous period, with green or red to show status.
- Middle: breakdown by channel. Orders, leads or revenue per channel (paid, organic, social, email) explain where the result came from.
- Bottom: the comment. Three or four sentences: what happened, why, what you will do next month.
- Detail pages after that, one per channel, with the metrics you use for diagnosis.
Keep the same layout, the same periods and the same definitions every month. If you change the attribution window or the conversion goal, write it in the report.
The practical problem is that KPIs live in different tools: ROAS in Google Ads and Meta Ads, organic clicks in Search Console, revenue in Google Analytics 4, email clicks in Mailchimp. Copying them into spreadsheets every month takes hours and introduces errors. Klyrax connects to these platforms in read-only mode and puts the KPIs of each client in one live dashboard, which you can share as a link or export to PDF and PowerPoint. For a full monthly SEO structure, see our SEO report guide.
Common mistakes with marketing KPIs
- Too many KPIs. Twenty "key" indicators means none is key. Cut to 3 to 5 per goal.
- Vanity metrics as KPIs. Followers, impressions and page views are easy to grow and say little about revenue unless the goal is pure awareness.
- No target. A KPI without a target is just a number. Write the target before the period starts.
- Different definitions over time. Changing how a conversion is counted breaks every comparison with past months.
- Trusting platform totals. Google Ads and Meta Ads can both claim the same sale. Compare platform conversions with the real orders in your shop or CRM, and check the conversion tracking setup when numbers diverge.
- Reporting without a comment. A dashboard shows what happened. The client also needs to know why and what comes next.
Pick fewer KPIs, tie each one to a goal and a formula, and review them on a fixed schedule. A short dashboard read every month is worth more than a long report nobody opens.
Frequently asked questions
What are KPIs in marketing?
KPIs in marketing are key performance indicators: measurable values that show whether a marketing activity is reaching a defined business goal. A KPI always has a target and a deadline, for example a ROAS of at least 3.5 on Google Ads this quarter. Impressions, likes or sessions are metrics; they become KPIs only when they are tied to a goal you act on.
What is the difference between a KPI and a metric?
A metric is any number you can measure, such as clicks, followers or page views. A KPI is a metric you have chosen because it tells you whether you are reaching a goal, and it comes with a target. Every KPI is a metric, but most metrics are not KPIs. A typical account has hundreds of metrics and only 3 to 5 KPIs per goal.
How many marketing KPIs should I track?
Track 3 to 5 KPIs per business goal, and no more than 8 to 10 on the main dashboard. Beyond that, nobody reads them and the numbers that matter get lost. Keep the other metrics in detail pages for diagnosis: you look at them when a KPI moves, not every week.
What are examples of marketing KPIs?
Common marketing KPIs are ROAS and cost per acquisition for paid ads, organic clicks and non-brand traffic for SEO, engagement rate for social media, click rate for email and conversion rate and average order value for e-commerce. Which ones apply to you depends on your goal: a shop selling online and a B2B company collecting leads need different KPIs.
What should a marketing KPI dashboard include?
A marketing KPI dashboard should show 4 to 8 KPIs at the top, each with the current value, the target and the change against the previous period. Below that, add a breakdown by channel and a short written comment that explains what happened and what you will do next. Use the same structure every month so changes are easy to spot.
All your marketing data in one report
Klyrax connects Google Ads, Meta Ads, GA4, Search Console, Bing Webmaster Tools and more in read-only mode, and turns them into client-ready reports.
Request info