
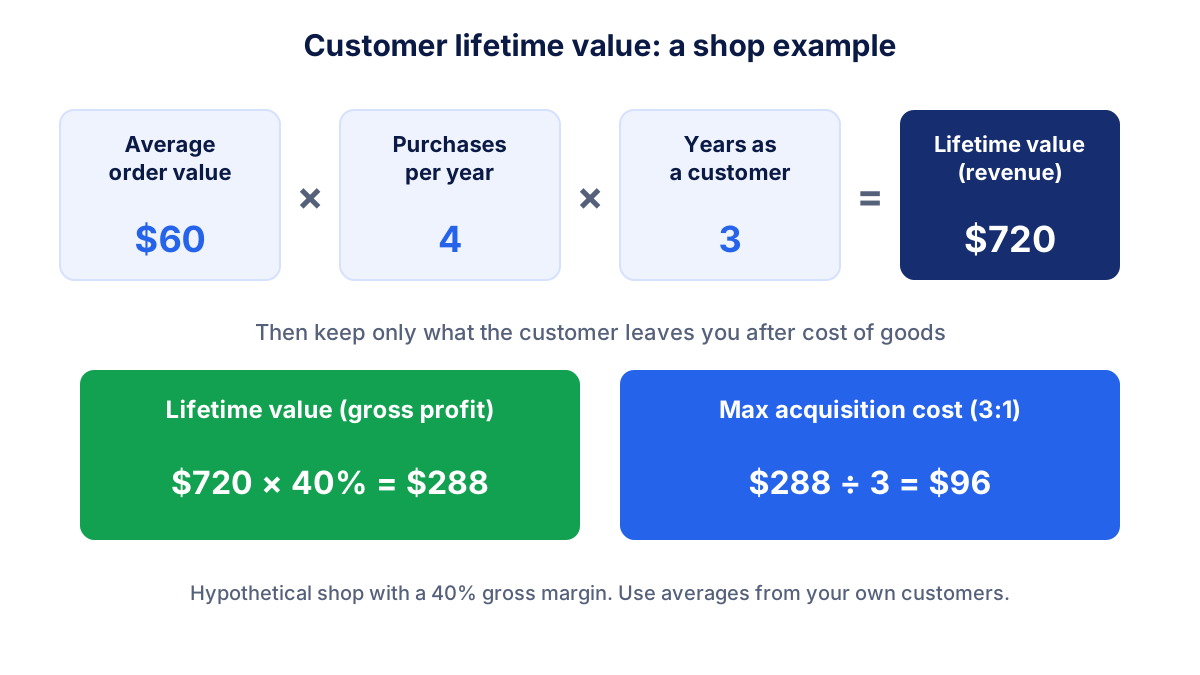
Customer lifetime value (CLV or LTV) is how much an average customer brings to your business over the whole relationship, not just on the first order. To calculate it, multiply average order value by purchases per year and by years as a customer, then multiply by your gross margin. A customer who spends $60 four times a year for three years is worth $720 in revenue and $288 in gross profit at a 40% margin.
This guide covers the three customer lifetime value formulas you actually need, worked examples for a shop, a service business and a subscription, an LTV calculator, the LTV:CAC ratio and the mistakes that make lifetime value look better than it is.
What is customer lifetime value?
Customer lifetime value is the revenue, or better the gross profit, that an average customer generates from their first purchase to their last. It turns a string of small orders into one number you can compare with what it costs to win that customer.
The idea matters most when the first sale does not pay for itself. Many shops lose money on a customer's first order once advertising is counted, and only make it back on the second, third and tenth. Without a lifetime value figure, you would cut campaigns that are in fact profitable, or keep campaigns that bring one-off buyers who never return.
CLV and LTV mean the same thing. Some people say LTV for subscriptions and CLV for shops, but the logic is identical. What changes the number much more is whether you count revenue or margin.
The customer lifetime value formula: three versions
The simple formula (revenue)
Customer lifetime value = average order value × purchases per year × years as a customer
With an average order of $60, 4 purchases a year and 3 years as a customer: $60 × 4 × 3 = $720. This is the version most articles stop at. It is easy to explain and dangerous to use for decisions, because $720 of sales is not $720 you can spend.
The margin-based formula (the useful one)
Customer lifetime value (gross profit) = average order value × purchases per year × years × gross margin
Gross margin is what is left of each sale after the cost of the goods or the direct cost of the service. At 40%, the same customer leaves you $720 × 0.40 = $288. This is the figure to compare with your acquisition cost, because marketing is paid out of margin, not out of sales.
The churn-based formula (subscriptions)
If customers pay every month, you rarely know in advance how many years they will stay, but you do know how many cancel. Monthly churn rate is the share of customers who leave each month.
Customer lifetime value = average monthly revenue per customer ÷ monthly churn rate
With $50 a month and 4% monthly churn, the average customer stays 1 ÷ 0.04 = 25 months and brings $50 ÷ 0.04 = $1,250. Multiply by gross margin as before. The shortcut assumes churn stays roughly constant, so base it on at least six to twelve months of cancellations. The article on churn rate explains how to measure it.
| Version | Formula | Use it when |
|---|---|---|
| Simple | AOV × purchases per year × years | You want a first rough idea |
| Margin-based | simple CLV × gross margin | You decide how much to spend on marketing |
| Churn-based | monthly revenue per customer ÷ monthly churn | Customers pay a recurring fee |
LTV calculator
Enter the averages from your own customers. Gross margin is optional: add it to see the lifetime value in gross profit and the maximum acquisition cost at a 3:1 ratio, which is simply gross-profit CLV ÷ 3.
Customer lifetime value calculator
Use averages from your own customers: the result updates as you type.
If you do not know your purchase frequency, take the number of orders in the last 12 months and divide it by the number of distinct customers who ordered in the same period.
Worked examples: a shop, a service business and a subscription
All three businesses are hypothetical, with round numbers.
An online shop selling coffee and accessories: average order $60, 4 orders a year, customers stay 3 years, gross margin 40%. Revenue lifetime value is $720, gross profit lifetime value $288, so the shop can afford to spend up to about $96 to win a customer and still respect the 3:1 rule of thumb.
A service business that maintains air conditioning in offices: average job $500, 3 jobs a year, clients stay 4 years, gross margin 50% after technicians' time and parts. Revenue lifetime value is $6,000, gross profit $3,000, and the acquisition ceiling at 3:1 is $1,000. That explains why paying $150 for a qualified lead can be a bargain for this company and a disaster for the coffee shop.
A subscription at $50 a month with 4% monthly churn and a 70% gross margin: revenue lifetime value $1,250, gross profit $875, acquisition ceiling about $292.
| Business | Revenue CLV | Gross margin | Gross profit CLV | Max CAC at 3:1 |
|---|---|---|---|---|
| Online shop | $720 | 40% | $288 | $96 |
| Service business | $6,000 | 50% | $3,000 | $1,000 |
| Subscription | $1,250 | 70% | $875 | about $292 |
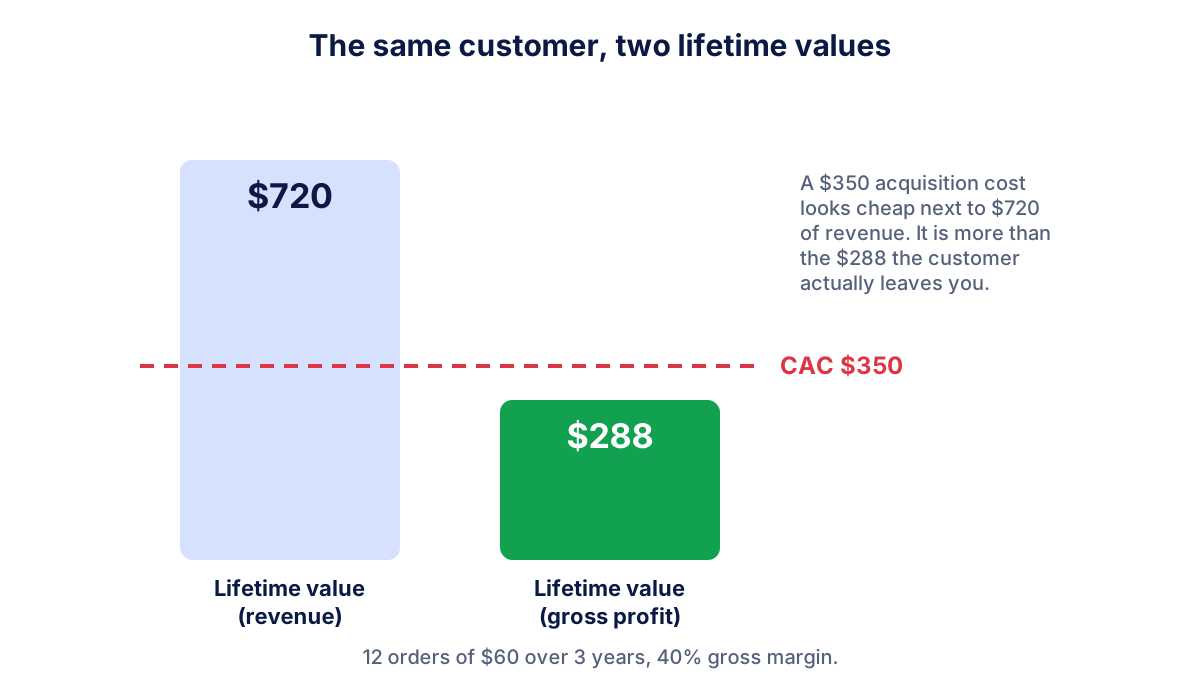
The gap between the two columns is the whole point. Spend $350 to win a coffee customer and the revenue figure says you are fine. The margin figure says you lose $62 on every new customer before paying a single other cost.
The LTV:CAC ratio: how much can you spend to win a customer?
Customer acquisition cost (CAC) is what you spend on marketing and sales divided by the number of new customers. The guide to customer acquisition cost shows what to include. Put the two numbers side by side and you get the LTV:CAC ratio.
LTV:CAC = gross profit lifetime value ÷ customer acquisition cost
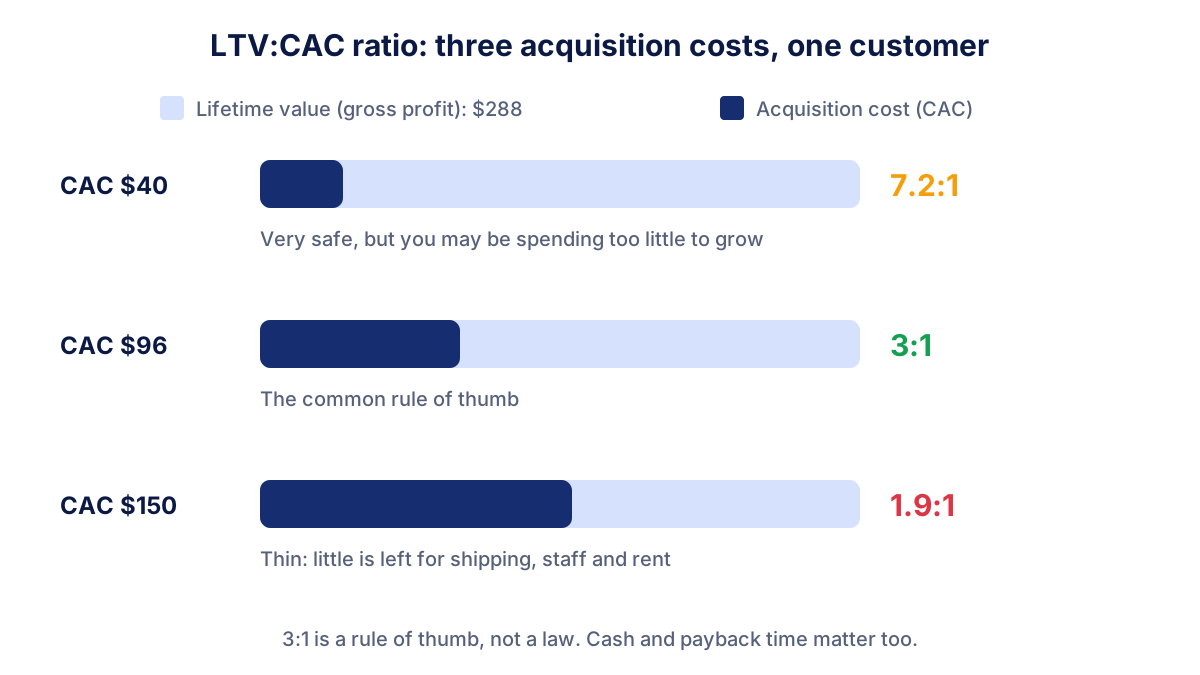
A ratio around 3:1 is the figure you will hear most often, especially in software. Read it as a rule of thumb, not a law. The gross profit left after acquisition still has to pay for shipping, returns, staff, rent and your own salary, and 3:1 leaves room for those in many businesses. Some can live with less, for example when customers pay a year in advance. Others need more, for example when margins are thin and returns are frequent.
How to read your ratio:
- Below 1:1. Each new customer costs more than they will ever leave you. Fix this first.
- Between 1:1 and 3:1. You make money on paper, but slowly. Check how many months it takes to recover the CAC.
- Around 3:1. A comfortable zone for most small businesses.
- Well above 3:1. Safe, and possibly a sign that you could spend more on campaigns that already work.
Payback time is the other half. A 3:1 ratio over five years ties up far more cash than the same ratio over one year. For a small business, recovering the acquisition cost within the first year is usually more important than the ratio itself.
How to raise customer lifetime value
Each factor in the formula is a lever. Small changes multiply.
- Get the second order. The step from one purchase to two is usually where most customers are lost. A follow-up email a few weeks after delivery, a refill reminder or a small offer on the next order can move it. Check that those emails are actually read with the guide to email open rates.
- Raise average order value. Bundles, a free shipping threshold slightly above your current average, or a relevant add-on at checkout.
- Keep customers longer. Answer complaints fast, make cancellation reasons visible, and contact customers who have not ordered for longer than usual.
- Protect the margin. Constant discounts raise orders and lower the gross-profit lifetime value. Compare both before and after a promotion.
- Win the right customers. Customers from some channels come back far more often than others. If you can, compare repeat purchase rate by the channel of the first order.
In the reports we read with business owners, the second lever is often the quickest, because it changes every future order without needing new customers.
Common mistakes when calculating lifetime value
- Using revenue instead of margin. The most expensive mistake: it makes every acquisition cost look affordable.
- Guessing a long lifetime. A two-year-old business cannot know that customers stay seven years. Cap the lifetime at what your data shows.
- One average for everyone. A few big customers can lift the average far above the typical customer. Look at the median too, or split by product or channel.
- Forgetting returns, refunds and discounts. Use net revenue, after returns.
- Comparing with the wrong CAC. The CPA shown in an ad platform counts only ad spend and the conversions it tracked. Compare lifetime value with the full acquisition cost, calculated on new customers only.
- Calculating it once. Lifetime value changes when prices, margin or retention change. Recalculate it every quarter.
Where to find the data and how often to check it
The inputs for customer lifetime value come from your own sales data: the order history in your shop platform, your invoicing software or your CRM. Export orders with a customer ID, date and value, and you have average order value, frequency and the time between first and last order. Margin comes from your accounts. Google Analytics 4 also offers a user lifetime exploration with lifetime revenue per user, but it only sees purchases tracked on your website and treats each device as a separate user unless you send a user ID, so it usually understates repeat buyers.
Lifetime value also helps when setting up campaigns. Google Ads can bid higher for new customers with its customer acquisition goal, and the extra value you assign to a new customer is easier to choose once you know what one is worth.
The other half of the ratio is acquisition cost, spread across several ad accounts. Klyrax puts your spend from Google Ads, Meta Ads and Microsoft Ads in one summary, compared with the previous period, so you can set it against the lifetime value you calculated from your shop or CRM. Klyrax does not calculate CLV for you: that number stays yours. For the rest of the weekly shop numbers, see the guide to ecommerce KPIs and the one on marketing ROI.
Frequently asked questions
What is customer lifetime value in simple terms?
Customer lifetime value is the total an average customer spends with you, or better the gross profit they leave you, from the first purchase to the last. If a customer buys 4 times a year at $60 for 3 years, the revenue lifetime value is $720. With a 40% gross margin, the customer leaves you $288 to pay for marketing, staff and rent.
What is the formula for customer lifetime value?
The simple customer lifetime value formula is average order value × purchases per year × years as a customer. The more useful version multiplies the result by your gross margin, so you count profit instead of sales. For subscriptions, divide the average monthly revenue per customer by the monthly churn rate: $50 with 4% churn gives $1,250.
What is a good LTV to CAC ratio?
A ratio of about 3:1, meaning lifetime gross profit three times higher than the cost of winning the customer, is the most quoted rule of thumb. It is not a law. Below 1:1 you lose money on every new customer. Well above 3:1 you are safe but may be spending too little to grow. Cash and payback time matter as much as the ratio.
What is the difference between CLV and LTV?
There is no difference in practice. CLV stands for customer lifetime value and LTV for lifetime value, and both describe the same idea. Some teams use LTV for subscription businesses and CLV for shops, but the formulas are the same. What matters more is whether the number is based on revenue or on gross margin, so always say which one you used.
How many years should I use for customer lifetime?
Use what your own data shows: the average time between a customer's first and last order, or 1 ÷ churn rate for subscriptions. If your business is young, do not guess ten years. Cap the lifetime at two or three years, which keeps the number conservative and closer to the period in which you actually need to recover the acquisition cost.
See how your marketing is really doing
Klyrax connects GA4, Search Console, Google Ads, Meta Ads, your Google reviews and more in read-only mode, shows the numbers that matter for your business and writes you a plain-language report every month.
Request info