
Churn rate is the share of customers you lose in a period, and retention rate is the share you keep. If you start the month with 200 customers and 10 leave, your monthly churn rate is 5% and your retention rate is 95%. Both are calculated on the customers you had at the start, so new customers cannot hide the ones you lost.
This guide gives you both formulas with a worked example, explains why monthly churn cannot simply be multiplied by 12, shows how to measure churn in a shop without subscriptions, and builds a small cohort table you can copy in a spreadsheet.
What is churn rate, and what is retention rate?
Churn rate is the percentage of customers who stop being customers during a period: they cancel a contract, do not renew, or simply stop buying. Retention rate is the percentage of customers who are still with you at the end of the same period.
Both numbers answer the same question from two sides: how good is your business at keeping the customers it already paid to win? That question matters because winning a customer costs money. The guide to customer acquisition cost shows how to calculate that cost. Churn tells you how long you get to earn it back.
How to calculate churn rate and retention rate
The two formulas:
Churn rate = customers lost in the period ÷ customers at the start of the period × 100
Retention rate = (customers at the end minus new customers in the period) ÷ customers at the start × 100
A worked example with round, hypothetical numbers. A company sells a monthly maintenance service. On 1 March it has 200 customers. During March, 10 customers cancel and 15 new customers sign up, so on 31 March it has 205.
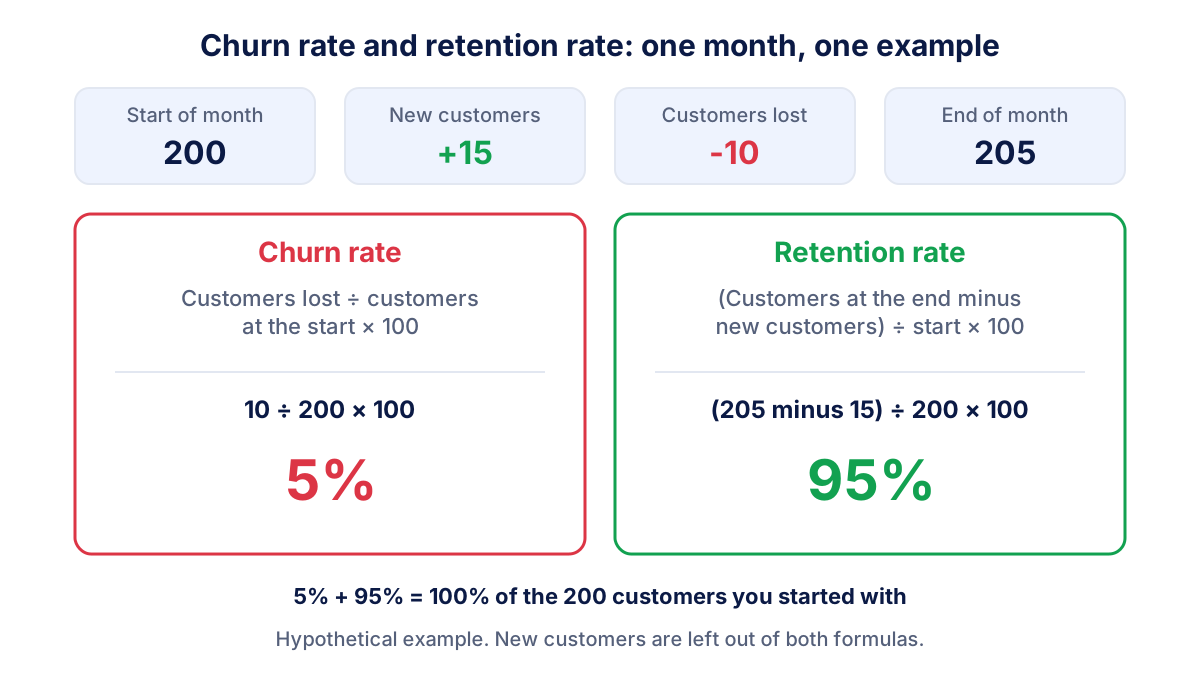
- Churn rate: 10 ÷ 200 × 100 = 5%
- Retention rate: (205 minus 15) ÷ 200 × 100 = 95%
- Net change in customers: from 200 to 205, plus 2.5%
The last line is the trap. The customer count grew, so the month looks fine. Yet one customer in twenty left. If acquisition slows down next month, the same churn will make the total shrink.
How churn and retention relate
When you calculate both on the same starting customers and the same period, churn rate plus retention rate equals 100%. Retention = 100% minus churn. In the example, 5% + 95% = 100%.
| Churn rate | Retention rate | |
|---|---|---|
| Measures | customers lost | customers kept |
| Formula | lost ÷ start × 100 | (end minus new) ÷ start × 100 |
| Example | 5% | 95% |
| Good direction | down | up |
| Best used for | finding reasons for leaving | talking about loyalty with a team |
Monthly vs annual churn: why 5% a month is not 60% a year
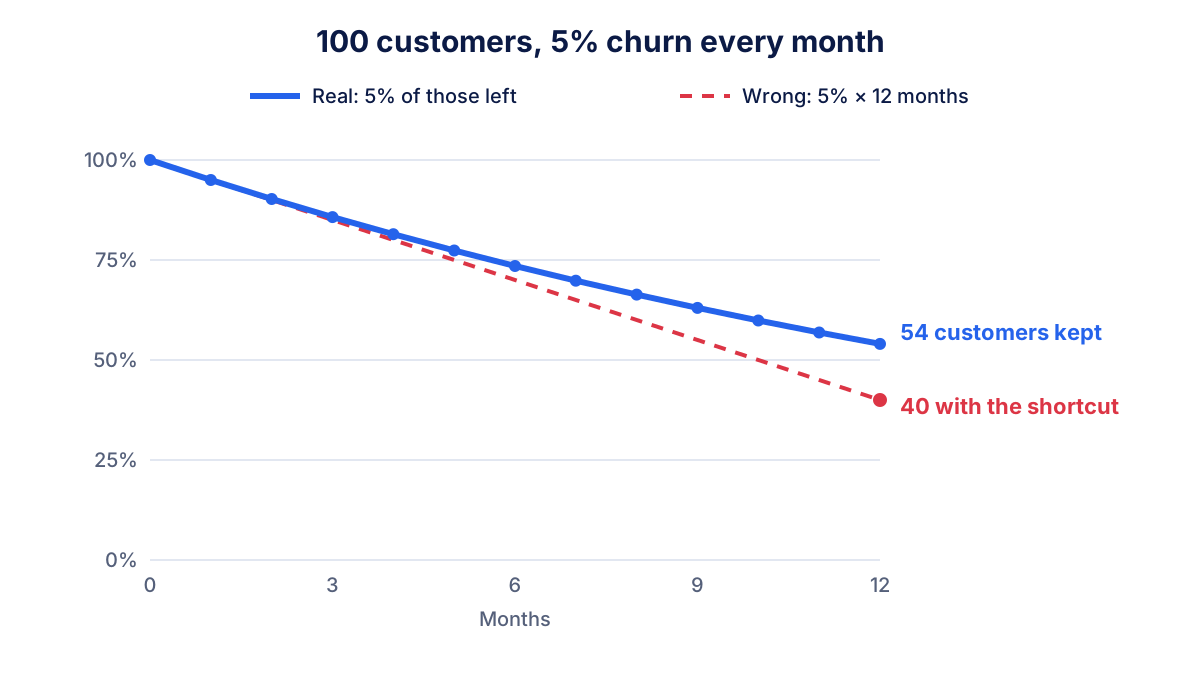
Multiplying monthly churn by 12 is the most common mistake with this metric. Each month you lose 5% of the customers that are left, not 5% of the customers you started the year with. The losses get smaller as the base shrinks.
Annual churn = 1 minus (1 minus monthly churn)^12
With 5% monthly churn: 0.95 to the power of 12 is about 0.54. You keep about 54% of the customers you had in January, so annual churn is about 46%, not 60%.
| Monthly churn | Customers kept after 12 months | Annual churn |
|---|---|---|
| 1% | about 89% | about 11% |
| 2% | about 78% | about 22% |
| 3% | about 69% | about 31% |
| 5% | about 54% | about 46% |
| 10% | about 28% | about 72% |
Two practical consequences. When you compare yourself with a figure you read somewhere, check whether it is monthly or annual. And small monthly improvements add up: going from 3% to 2% a month keeps about 9 more customers out of 100 at the end of the year.
Churn rate without subscriptions: shops and repeat purchases
An online shop, a dental practice or a garden center has no cancellations to count. Customers just stop coming back. To measure churn you need a definition of "lost" based on inactivity:
- Look at how often your customers buy. If a typical customer reorders every 2 months, someone who has not ordered for 2 months is not lost yet.
- Pick an inactivity window that is clearly longer than the usual gap between orders, for example 6 months for consumables or 12 months for seasonal products.
- Count active customers at the start of a period: everyone who bought within the window.
- Count how many of them passed the window without buying by the end of the period. That number divided by the active customers at the start is your churn.
A hypothetical shop has 1,000 active customers on 1 July (at least one order in the previous 6 months). By 30 September, 150 of them have gone 6 months without an order. Quarterly churn is 150 ÷ 1,000 × 100 = 15%, retention 85%.
If one of those 150 orders again in October, count them as a reactivated customer. Do not rewrite the September figure. The ecommerce KPIs guide uses a related number, the repeat purchase rate: the share of customers with two or more orders. Repeat purchase rate tells you how many customers come back at all, churn tells you how many you are losing right now.
A simple cohort table
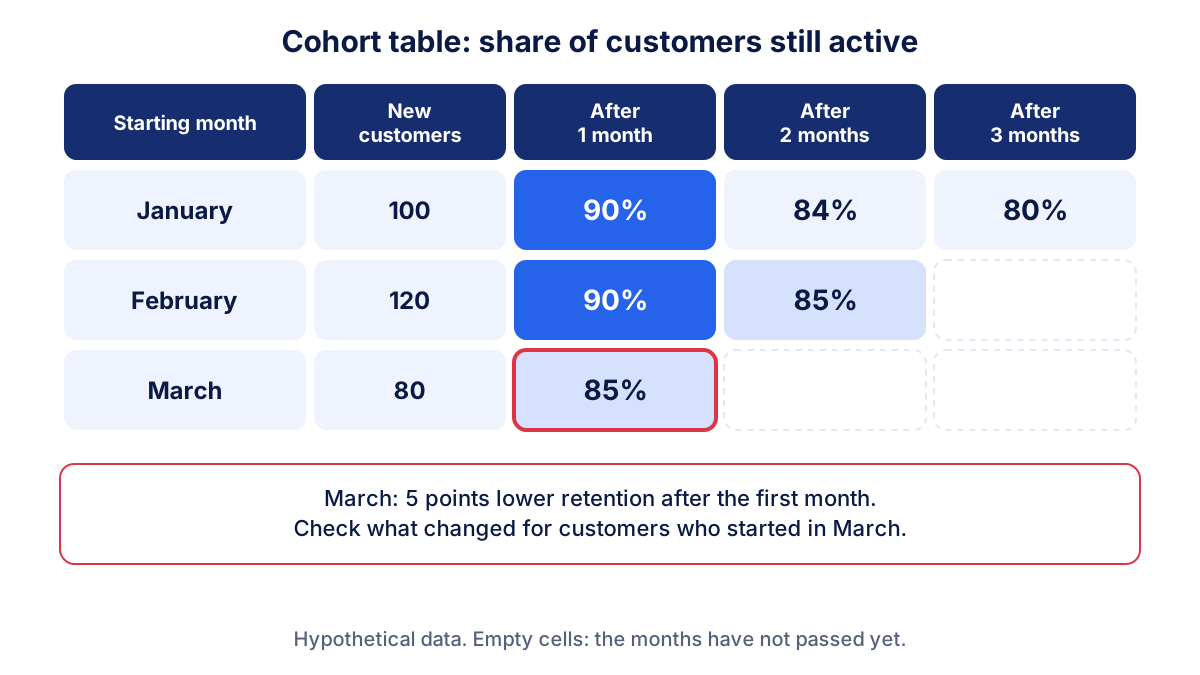
A single churn number mixes old and new customers. A cohort table separates them: each row is a group of customers who started in the same month, each column shows how many of them are still active after 1, 2 or 3 months.
| Starting month | New customers | After 1 month | After 2 months | After 3 months |
|---|---|---|---|---|
| January | 100 | 90% | 84% | 80% |
| February | 120 | 90% | 85% | |
| March | 80 | 85% |
Read the table by column. After one month, January and February kept 90% of their customers, March only 85%. Something changed for customers who started in March: a new campaign that attracted a different kind of buyer, a discount that drew bargain hunters, a slower delivery. A single overall churn figure would never show this.
You can build this table in a spreadsheet from your billing or shop export: one row per customer with the month of their first purchase and the month of their last activity. For website visitors, Google Analytics 4 has a cohort exploration that groups users by first visit and shows how many return. That measures visitors, not paying customers, so use it as a signal next to your own data.
What is a good churn rate?
No honest single number exists. Churn depends on contract length, price, whether you sell to businesses or consumers, and how you define a lost customer. B2B services with annual contracts usually lose far fewer customers than consumer monthly subscriptions, which can lose several percent every month. In many shops a large share of first-time buyers never order again. Published figures range widely and are measured in different ways, so treat any average you find as a rough reference.
Use three comparisons instead of an industry average:
- Your own trend: this month against the last 6 to 12 months.
- Your cohorts: are newer customers staying longer than older ones?
- Your economics: churn is too high when customers leave before their margin has paid back what it cost to acquire them.
Churn, retention and customer lifetime value
Churn tells you how long a customer stays on average, and that is half of customer lifetime value.
Average customer lifetime (months) ≈ 1 ÷ monthly churn
With 5% monthly churn, the average customer stays about 1 ÷ 0.05 = 20 months. If each customer leaves you $60 of gross margin a month, lifetime value is about $60 × 20 = $1,200. Cut churn to 4% and the average lifetime becomes 25 months, lifetime value $1,500, without winning a single extra customer.
This is why churn and acquisition cost belong on the same page. A customer who costs $200 to win and leaves $60 a month pays back in under 4 months. If many customers leave in month 2 or 3, they never do.
How to reduce churn
Start by finding out why customers leave. Ask in the cancellation flow, call a few lost customers, read support tickets. The answers are usually more specific than "price".
- Onboarding. Many customers leave early because they never got the value they paid for. A clear first week (welcome email, setup help, a check-in call for B2B) protects the first month, where churn is often highest.
- Email. Send useful emails at the moments that matter: after the first purchase, before a renewal, when a customer has gone quiet. Watch unsubscribes and clicks on those emails. The guide to email open and click rates explains how to read them.
- Service. Fast answers to problems keep customers who would otherwise leave quietly. Track complaints by topic.
- Failed payments. In subscription businesses some churn is involuntary: an expired card. Payment reminders recover part of it.
- Longer commitments. Annual plans, with a fair discount, reduce monthly decisions to leave.
Where to find the numbers each month
Customer churn itself comes from your billing system, shop platform or CRM: that is where cancellations and orders live. Your marketing tools show the signals around it. In GA4, the retention overview report shows new and returning users. Mailchimp shows opens, clicks and unsubscribes of your retention emails.
Klyrax does not calculate churn from your billing data. It puts the marketing side next to each other in one dashboard, Mailchimp campaigns, returning visitors from GA4 and your ads, so you can see whether your retention emails and campaigns move while you check churn in your own system.
Common mistakes with churn rate
- Counting new customers in the denominator. Use only customers at the start of the period, or growth will dilute churn.
- Multiplying monthly churn by 12. Churn compounds: use 1 minus (1 minus monthly churn) to the power of 12.
- Changing the definition of "lost". A 6-month window one quarter and 12 months the next makes trends meaningless.
- Reading tiny numbers. With 30 customers, one cancellation is 3.3% churn. Use quarters or cohorts.
- Looking only at customer churn. Ten small customers leaving hurts less than one large one. If customers pay very different amounts, also track revenue lost.
- Ignoring cohorts. A stable overall churn rate can hide newer customers leaving faster than older ones.
Check churn every month with the same definition, next to what each customer cost you. The marketing KPIs guide shows how to fit it into a short list of numbers you review regularly.
Frequently asked questions
What is churn rate?
Churn rate is the percentage of customers who stop buying from you or cancel during a period. The formula is customers lost in the period ÷ customers at the start of the period × 100. If you start the month with 200 customers and 10 cancel, monthly churn is 5%. New customers who join during the month are not part of the calculation.
How do you calculate customer retention rate?
Customer retention rate is (customers at the end of the period minus new customers acquired in the period) ÷ customers at the start × 100. With 200 customers at the start, 15 new ones and 205 at the end, retention is (205 minus 15) ÷ 200 × 100 = 95%. Removing new customers matters: otherwise growth hides the customers you lost.
What is the difference between churn rate and retention rate?
Churn rate measures the customers you lost, retention rate the customers you kept, both as a share of the customers you had at the start. When both are calculated on the same group and period, churn plus retention equals 100%. Retention is easier to discuss with a team, churn is easier to link to causes such as cancellations.
What is a good churn rate?
There is no single good churn rate. It depends on your sector, contract length, price and whether customers are businesses or consumers. B2B services with annual contracts usually lose far fewer customers than consumer monthly subscriptions, which can lose several percent a month. Compare your churn with your own previous months and with your margin, not with a generic average.
How do you calculate churn without subscriptions?
Define when a customer counts as lost, for example no order for 6 or 12 months, based on how often your customers usually buy. Then count the active customers at the start of a period and how many of them crossed that inactivity line by the end. The ratio is your churn. Keep the same definition every time.
See how your marketing is really doing
Klyrax connects GA4, Search Console, Google Ads, Meta Ads, your Google reviews and more in read-only mode, shows the numbers that matter for your business and writes you a plain-language report every month.
Request info